Stephen V. Smith and James T. Hollibaugh

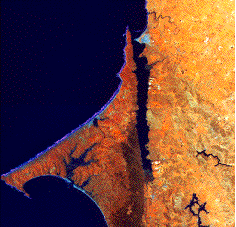
NASA ER-2 false color infrared photograph of Tomales Bay, California, and surrounding watershed.
For scale, the bay is approximately 20 km in length and is oriented NW-SE. (NASA photo).
Click on the small pictures to see them at a larger size.
 Figure 1. Map of Tomales Bay and its surrounding watershed. The map shows the location of major water catchment reservoirs, stream gauging stations, weather stations, and the "BRIE" research laboratory.
 Figure 2. Map of Tomales Bay sampling stations.
DATA SETS DIRECTLY ACCESSIBLE THROUGH THIS PAGE:
Tomales Bay and Lagunitas Creek water temperature.
Tomales Bay dissolved load water composition.
Tomales Bay particulate load composition.
Lagunitas Creek and Walker Creek water composition data
Tomales Bay water column biotic variables.
Tomales Bay sediment nutrient fluxes.
Tomales Bay meteorological data.
Watershed rainfall and water storage
LINKS TO OTHER DATA SETS USED IN THIS PROGRAM:
Lagunitas Creek near Point Reyes Station stream flow.
Lagunitas Creek at Samuel P Taylor Park stream flow.
Walker Creek near Marshall stream flow.
Walker Creek near Tomales stream flow. NOTE: This gauge is no longer in service, but the historical data are useful.
NOAA Coastal Upwelling data (Bakun index).
This web page shows the long-term monthly means at locations along the North
American Pacific coast. Various breakdowns of the data are available by contacting
NOAA.
DESCRIPTION OF TOMALES BAY AND THE LMER/BRIE RESEARCH PROGRAM:
Tomales Environment
Research Accomplishments
Research Organization
Facilities
LMER/BRIE publications list
Participants
Return to Tomales LMER/BRIE Research Program Home Page

This page was last updated by SVS October 15,2001.

Maintained by Stephen V. Smith at svsmith@soest.hawaii.edu


 Figure 1. Map of Tomales Bay and its surrounding watershed. The map shows the location of major water catchment reservoirs, stream gauging stations, weather stations, and the "BRIE" research laboratory.
 Figure 2. Map of Tomales Bay sampling stations.
