
NUTRIENT
ANALYSIS METHODS MANUAL
FOR HUMIC-CONTAINING ESTUARINE WATERS
AUTHORS/CONTACTS:
Joan E. Sheldon and
Dr. William J. Wiebe
Revision Date: June 7, 1997
NITRITE
Using a manual version of this method, colored water resulted in low
recovery of added nitrite after subtraction of the color blank.
Better (virtually 100%) recovery using the autoanalyzer method
may be due to dilution of the sample with water to the point
where only a small additive component of the absorbance is due to
color.
SAMPLES
Sample Volume:
6 mL
Sample Collection:
Filter through ashed GF/F filter in glass or
plastic apparatus, ashed or used only for similar samples.
Sample Storage:
in polyethylene bottle at -20 oC or lower
REAGENTS
Color reagent:
Mix 100 mL concentrated (80%) H3PO4 and approx.
750 mL water, then add 10 g sulfanilamide and dissolve. Add
0.5 g NNED (N-1-naphthylethylenediamine dihydrochloride) and
dissolve. Make up to 1 L with water and add 0.5 mL Brij-35®
surfactant. Store in a dark bottle in refrigerator.
Color blank reagent:
Dilute 100 mL concentrated (80%) H3PO4 to 1 L
with water and add 0.5 mL Brij-35® surfactant.
STANDARDS
5 mM Primary:
Dry NaNO2 for about 1 hour at 100 oC. Dissolve
0.345 g and make up to 1 L with water. Preserve with a few
drops of chloroform and store in a dark bottle in
refrigerator.
500 uM Secondary:
1 mL Primary Standard + 9 mL water, or similar
convenient amount. Make fresh each day.
Working:
Make fresh each day.
0.5 uM: 9.990 mL water + 10 uL Secondary Std.
1 uM: 9.980 mL water + 20 uL Secondary Std.
2 uM: 9.960 mL water + 40 uL Secondary Std.
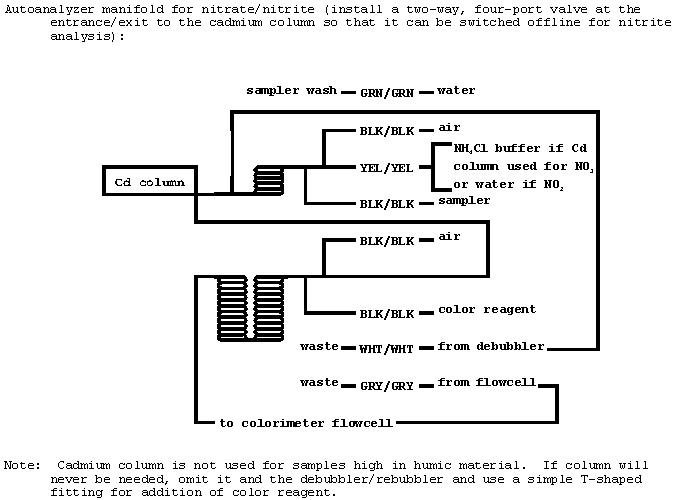
SPECIAL EQUIPMENT
Technicon AutoAnalyzer II with nitrite manifold
(reproduced from D'Elia et al., unpubl.), 50 mm x 1.5 mm
flowcell, 550 nm filters and phototubes 199-B021-01.
PROTOCOL
Based on standard Technicon method (No. 158-71W/B)(details per
D'Elia et al., unpubl.). A color blank procedure is used to
correct for humic color (Flebbe, 1982).
Autoanalyzer Set-Up:
Allow colorimeter and chart recorder to
warm up for approx. half an hour. Set zero and full scale
on chart recorder relative to colorimeter. Set Standard
Calibration setting 9.5, Damp setting 2, Sample Rate 40/hr,
Sample:Wash 9:1, Chart Speed 30 cm/hr. Pump with water in
sample line (i.e. sampler off) and color reagent in reagent
line until baseline stabilizes. Set baseline to desired
reading on chart recorder using the baseline knob on the
colorimeter. (Set to some low positive value, such as 5%
full scale, rather than zero to allow for any negative
drift.)
Make up triplicate working standards in test tubes, 10 mL each.
Partially fill (use approx. 2 mL) polyethylene autoanalyzer
cups set up in sampler tray in the following order (all in
triplicate): 2 uM std., 1 uM std., 0.5 uM std., water, 8
samples.
Run standards and samples for nitrite + color.
Run Samples For Color Blank:
Replace color reagent with color
blank reagent and allow baseline to stabilize. Do
NOT reset
baseline. Re-run samples only: standards do not require
color correction.
Autoanalyzer Shut-Down:
Pump with water in sample and reagent
lines for approx. 10 min. Shut off all components and
disengage pump.
CALCULATIONS
Estimate baseline for each peak, by interpolating between
beginning and ending baselines, for both nitrite + color and
color blank runs. Read the top of each peak. "Adjusted
peak height" = top of peak - baseline
"Corrected peak height" = "Adjusted peak height for NO2 + color"
- "Adjusted peak height for color blank"
Plot "Corrected peak height" of standards vs. concentration.
Obtain the slope and intercept of this line.
Sample concentration (uM) = (Sample "Corrected peak height" -
intercept) ÷ slope
No correction for salinity is necessary.
Limit of Detection:
2 std. dev. above blank approx. = 0.02 uM
Range:
approximately 45 uM by changing Standard Calibration setting.
Accuracy:
95% confidence limits for prediction of a concentration
near the mean for a typical standard curve (0.875 uM) approx. =
± 0.15 uM for a triplicate determination. (Confidence limits
for prediction near the ends of a standard curve are, of course,
somewhat larger.)
REFERENCES
D'Elia, C.F., N.L. Kaumeyer, C.L. Keefe, D.L. Shaw, K.V. Wood,
and C.F. Zimmermann. 1987 unpubl. Standard operating
procedures. Nutrient Analytical Services Laboratory,
Chesapeake Biological Laboratory, Solomons, Maryland.
Flebbe, P. 1982. Biogeochemistry of carbon, nitrogen, and
phosphorus in the aquatic subsystem of selected Okefenokee
Swamp sites. Okefenokee Ecosystem Investigations no. 8.
NITRITE
Using a manual version of this method, colored water resulted in low recovery of added nitrite after subtraction of the color blank. Better (virtually 100%) recovery using the autoanalyzer method may be due to dilution of the sample with water to the point where only a small additive component of the absorbance is due to color.
SAMPLES
- Sample Volume:
- 6 mL
- Sample Collection:
- Filter through ashed GF/F filter in glass or
plastic apparatus, ashed or used only for similar samples.
- Sample Storage:
- in polyethylene bottle at -20 oC or lower
REAGENTS
- Color reagent:
- Mix 100 mL concentrated (80%) H3PO4 and approx.
750 mL water, then add 10 g sulfanilamide and dissolve. Add
0.5 g NNED (N-1-naphthylethylenediamine dihydrochloride) and
dissolve. Make up to 1 L with water and add 0.5 mL Brij-35®
surfactant. Store in a dark bottle in refrigerator.
- Color blank reagent:
- Dilute 100 mL concentrated (80%) H3PO4 to 1 L
with water and add 0.5 mL Brij-35® surfactant.
STANDARDS
- 5 mM Primary:
- Dry NaNO2 for about 1 hour at 100 oC. Dissolve
0.345 g and make up to 1 L with water. Preserve with a few
drops of chloroform and store in a dark bottle in
refrigerator.
- 500 uM Secondary:
- 1 mL Primary Standard + 9 mL water, or similar
convenient amount. Make fresh each day.
- Working:
- Make fresh each day.
- 0.5 uM: 9.990 mL water + 10 uL Secondary Std.
- 1 uM: 9.980 mL water + 20 uL Secondary Std.
- 2 uM: 9.960 mL water + 40 uL Secondary Std.
SPECIAL EQUIPMENT
- Technicon AutoAnalyzer II with nitrite manifold
(reproduced from D'Elia et al., unpubl.), 50 mm x 1.5 mm
flowcell, 550 nm filters and phototubes 199-B021-01.
PROTOCOL
Based on standard Technicon method (No. 158-71W/B)(details per D'Elia et al., unpubl.). A color blank procedure is used to correct for humic color (Flebbe, 1982).
- Autoanalyzer Set-Up:
Allow colorimeter and chart recorder to warm up for approx. half an hour. Set zero and full scale on chart recorder relative to colorimeter. Set Standard Calibration setting 9.5, Damp setting 2, Sample Rate 40/hr, Sample:Wash 9:1, Chart Speed 30 cm/hr. Pump with water in sample line (i.e. sampler off) and color reagent in reagent line until baseline stabilizes. Set baseline to desired reading on chart recorder using the baseline knob on the colorimeter. (Set to some low positive value, such as 5% full scale, rather than zero to allow for any negative drift.)
Make up triplicate working standards in test tubes, 10 mL each. Partially fill (use approx. 2 mL) polyethylene autoanalyzer cups set up in sampler tray in the following order (all in triplicate): 2 uM std., 1 uM std., 0.5 uM std., water, 8 samples.
Run standards and samples for nitrite + color.
- Run Samples For Color Blank:
- Replace color reagent with color
blank reagent and allow baseline to stabilize. Do
NOT reset
baseline. Re-run samples only: standards do not require
color correction.
- Autoanalyzer Shut-Down:
- Pump with water in sample and reagent
lines for approx. 10 min. Shut off all components and
disengage pump.
CALCULATIONS
Estimate baseline for each peak, by interpolating between beginning and ending baselines, for both nitrite + color and color blank runs. Read the top of each peak. "Adjusted peak height" = top of peak - baseline
"Corrected peak height" = "Adjusted peak height for NO2 + color" - "Adjusted peak height for color blank"
Plot "Corrected peak height" of standards vs. concentration. Obtain the slope and intercept of this line.
Sample concentration (uM) = (Sample "Corrected peak height" - intercept) ÷ slope
No correction for salinity is necessary.
- Limit of Detection:
- 2 std. dev. above blank approx. = 0.02 uM
- Range:
- approximately 45 uM by changing Standard Calibration setting.
- Accuracy:
- 95% confidence limits for prediction of a concentration
near the mean for a typical standard curve (0.875 uM) approx. =
± 0.15 uM for a triplicate determination. (Confidence limits
for prediction near the ends of a standard curve are, of course,
somewhat larger.)
REFERENCES
- D'Elia, C.F., N.L. Kaumeyer, C.L. Keefe, D.L. Shaw, K.V. Wood,
and C.F.
- Zimmermann. 1987 unpubl. Standard operating
procedures. Nutrient Analytical Services Laboratory,
Chesapeake Biological Laboratory, Solomons, Maryland.
- Flebbe, P. 1982. Biogeochemistry of carbon, nitrogen, and
phosphorus in the
- aquatic subsystem of selected Okefenokee
Swamp sites. Okefenokee Ecosystem Investigations no. 8.
![]()
![]()
![]()
![]()
![]()